
Find out the core reporting definitions and meanings for the analytics and metrics used on the Metigy marketing platform.
Page Analytics
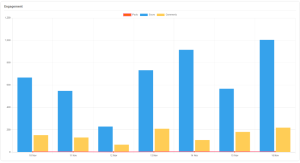
Engaged Users
The number of people who engaged with your Page. Engagement includes any click, action or story created.Engagement
Engagements are ways in which you are connecting with your users, Similar to reactions it shows how many times things occurred including views and clicks.Engagement Rate
Engagement Rate measures the effectiveness of your page and how much you are connecting with your fans. It is calculated as the number of weekly Page Engaged Users divided by the total page subscriber count.Impressions
How many times the page, or a piece of content from the page, is viewed? This can be a daily, weekly or monthly metric. There is a second version of this metric called unique impression (sometimes referred to as reach). That is where each user is only counted once, even if they have multiple impressions.Likes Change
The is calculated as the increase or decrease in page likes for the selected period, and so can be positive or negative.Likes
The total number of people who have liked your page. This varies by platform, and some support other definitions such as followers. A like of a page is strong as it usually means they value what the page is sayingNew Likes
The total number of new people who have liked your page in a given timeframe. This the total of organic and new paid likes.Paid Likes
The number of people who have liked your page as a result of paid advertising.Unpaid Likes
The number of people who have liked your page as a result of organic (seen in a feed) or viral (shared by a friend)Reach
How many people have seen any piece of content associated with your page within the platform? This can be a daily, weekly, or monthly metric. In reports, this is called Impressions Unique. This is the unique (individual) users who have viewed the content. If they viewed it multiple times, they would be counted as a single view.Subscribers
The total number of people who have liked or followed your page and will get posts from the page in their news feeds. A Subscriber might not necessarily Like a page, and is only interested in the feed.Stories
Stories are newsfeed items created by users related to your content. For example, every time they like or comment on a post, that generates a story in their newsfeed that their friend may see.T.A.T. – Talking About This
The number of People Talking About the page in a time frame. This is a metric that is specific to Facebook.T.A.T. Rate
The number of People Talking About the page is divided by the page subscriber count.Unlike
The number of people that have Unliked your Page within a time frame. This is used in the Likes Change calculation.Post-Analytics